
The House is the widest surface in the Akashic forecast. Every district is rated, and the ratings are translated into a simulated seat distribution. Most of those districts are not seriously in doubt. The majority is determined by the smaller field outside the Safe columns—and by whether changes within that field move independently or together.
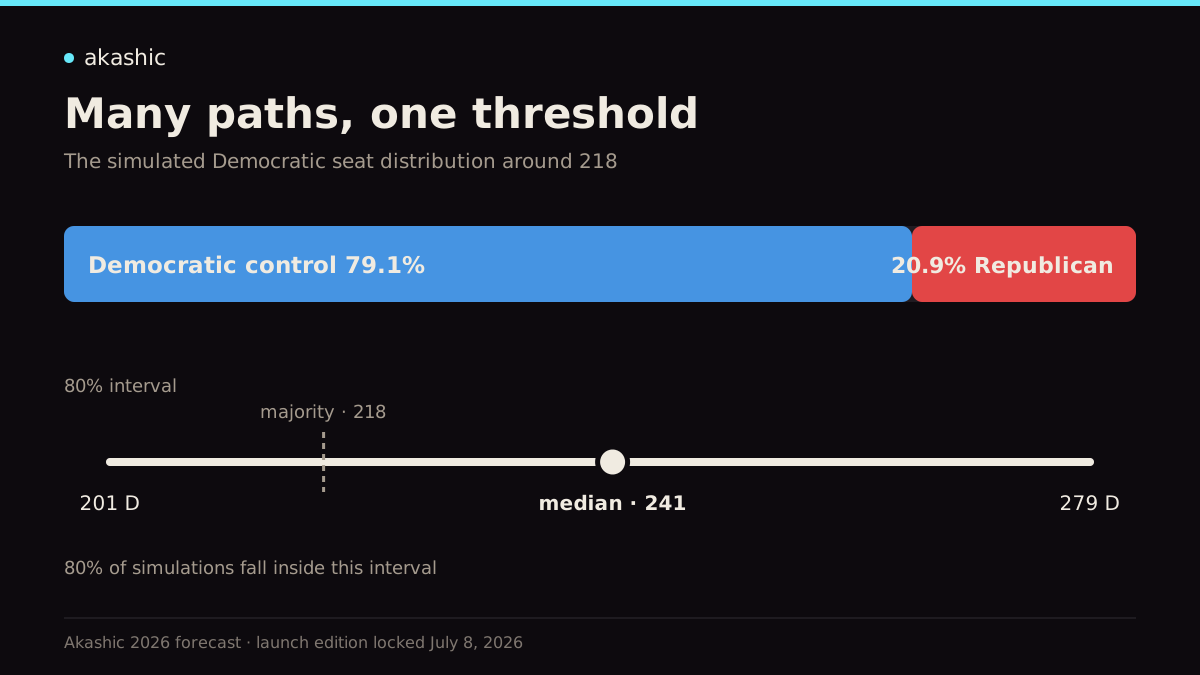
The launch edition favors Democrats, 79.1% to 20.9%. That topline is best understood beside the interval. The median is 241 Democratic seats, but the middle 80% of simulations runs from 201 to 279. The threshold at 218 sits well below the median and well inside the range.
| Measure | Launch edition, locked July 8 |
|---|---|
| Districts rated | 435 |
| Majority line | 218 |
| Democratic control probability | 79.1% |
| Republican control probability | 20.9% |
| Median Democratic seats | 241 |
| 80% interval | 201–279 Democratic seats |
| Safe seats | 351 |
| Non-safe races | 84 |
| Tilt races | 38 |
| Tipping-point district | WI-03 |
The range is not a contradiction of the control probability. It shows how correlated error works in a chamber election. If the national environment or a shared modeling assumption is wrong, many districts can move in the same direction. Democrats have more plausible routes to 218 in this edition, but a coordinated shift across the competitive field can still carry the chamber past the threshold.
The majority outside the Safe columns
The launch edition places 351 districts in the Safe categories: 203 Democratic and 148 Republican. That leaves 84 non-safe races. Thirty-eight are Tilt; the other 46 are Lean or Likely.
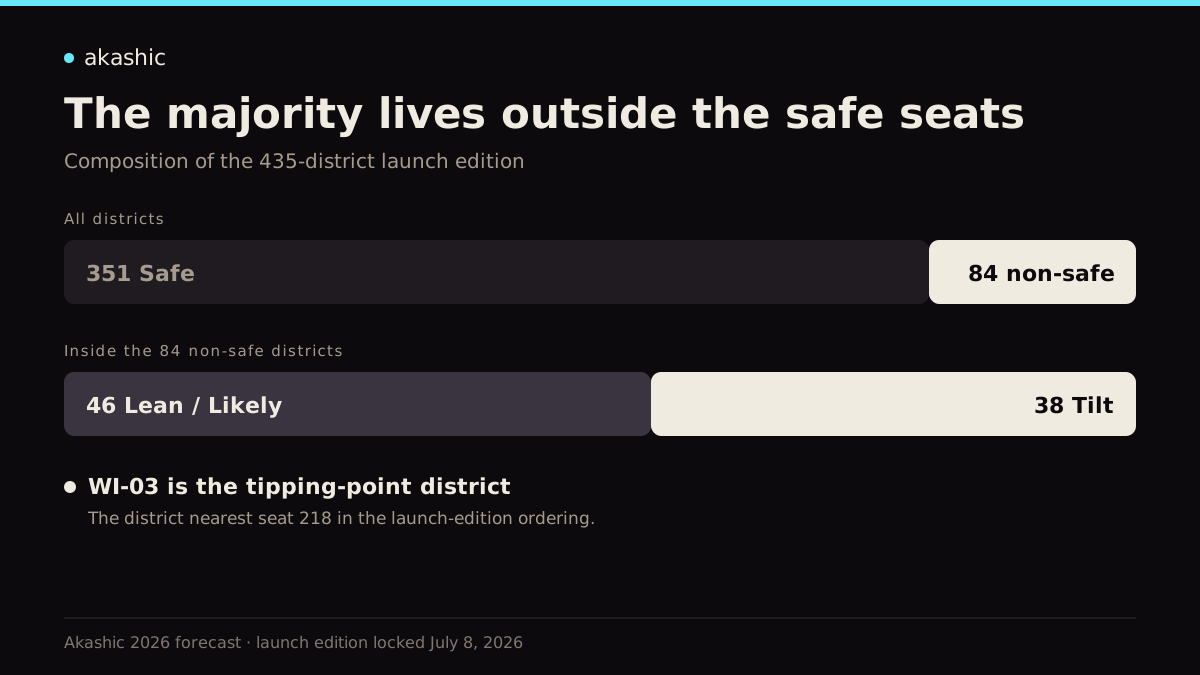
This is the central structural fact of the House map. The large Safe majority establishes the floor for each party, but the 84-seat live field is far wider than the 23 seats separating the Democratic Safe count from 218. Democrats do not need to win every race where they lead. Republicans, however, need the center of the distribution to move far enough that losses in one region are compensated by gains elsewhere.
The launch edition carries 41 projected flips. Many are Republican-held districts moving toward Democrats, with a smaller set moving the other way. Familiar Democratic opportunities include AZ-01, CA-22, NE-02, PA-07, and WI-03. Other calls reach farther from the presidential baseline and lean more heavily on candidate or local evidence.
A forecast with that many projected flips should be expected to miss individual races. The important question is whether the misses are balanced. If aggressive Democratic calls fail while Republican-held seats harden together, the distribution moves quickly toward 218. If errors break in both directions, Democrats retain more of the room visible between the threshold and the median.
WI-03, at the threshold
Wisconsin’s Third District is the launch edition’s tipping point. It is the district nearest seat 218 when the races are ordered by Democratic win probability. That makes it an index of the chamber’s center, not a declaration that Wisconsin alone will decide control.
The distinction is especially important in the House, where many combinations can produce the same majority. A party can lose the nominal tipping-point district and compensate elsewhere. What WI-03 tells us is the kind of seat near the threshold: competitive enough to move with the national environment, but grounded in a local electorate and campaign that can depart from it.
The districts around that point deserve more attention than the most dramatic outliers. A surprising result in a Safe or Likely seat may become the night’s story, but control is usually assembled through a run of less surprising results near the center. The tipping point gives that run a location.
Geography, density, and shared movement
The map view shows where each party’s opportunities are located. The spectrum shows how densely those opportunities cluster around the middle. Both are needed. A party with many narrowly favorable districts may have a strong median and substantial exposure to a modest national shift. A party with fewer but more geographically varied opportunities may be less sensitive to one regional miss.
That is why the wide interval belongs in the article, not only in the methodology. It acknowledges that district outcomes are related. Turnout, the national political environment, fundraising, and measurement error do not stop at district lines. The simulation’s shared national-swing component is an attempt to carry that relationship into the seat estimate rather than pretending 435 races are independent coin flips.
How to read this map
Read the control probability first, then place it against the interval and the 218 line. Move next to the 84 non-safe seats and the density of the 38 Tilt contests. Use the flip list to see where the forecast makes a claim about change, and open the district pages where that claim rests on the most contest-specific evidence.
The launch edition’s conclusion is that Democrats have more paths to 218 and considerable room around the median. Its caution is equally important: the interval includes a Republican majority, and the competitive field is broad enough for a shared national correction to travel through it. The House is not one race multiplied 435 times. It is 435 races connected by a common political climate and resolved at a single threshold.