
Election-night coverage asks who won. The next morning offers a different question: who showed up, and where?
The August 4, 2026 primaries in Missouri and Michigan let us sum the votes cast for every candidate of each party in the same contest. These sums are not literal counts of every Republican or Democratic ballot issued: voters can skip a race, uncontested nominations depress participation, and a competitive nomination can pull extra voters into one contest. They nevertheless reveal the geographic footprint of each party’s active primary electorate.
Missouri: a Republican state with one glaring congressional exception
The cleanest statewide benchmark is the state auditor contest. Republican candidates received 643,009 votes, Democrats 479,994, and Libertarians 6,716. That was 56.9% Republican, 42.5% Democratic, and 0.6% Libertarian—a 14.4-point Republican advantage across the full contest vote, or R+14.5 on a two-party basis.
The new 2nd Congressional District was almost perfectly divided: 86,168 Republican candidate votes to 85,780 Democratic votes, with another 843 Libertarian votes. Republicans led by only 388 votes, or 0.2 points of the full contest total. The same district voted for Donald Trump by about 11.5 points in 2024.
That does not make the district a November tossup by itself. Both parties held contested nominations, however, so the result is more informative than a comparison distorted by one party having no meaningful race. It shows that the new district’s double-digit Republican presidential advantage did not automatically reproduce itself among the voters who entered the August congressional contests.
| District | Republican votes | Democratic votes | Primary margin | 2024 presidential margin |
|---|---|---|---|---|
| MO-01 | 13,162 | 141,285 | D+82.7 | D+57.5 |
| MO-02 | 86,168 | 85,780 | R+0.2 | R+11.5 |
| MO-03 | 100,521 | 56,847 | R+27.6 | R+20.0 |
| MO-04 | 93,135 | 65,196 | R+17.6 | R+21.3 |
| MO-05 | 77,501 | 54,936 | R+16.9 | R+18.2 |
| MO-06 | 97,851 | 53,170 | R+29.4 | R+26.6 |
| MO-07 | 103,033 | 33,451 | R+50.6 | R+42.6 |
| MO-08 | 109,835 | 28,333 | R+58.7 | R+54.3 |
The margin columns use the full contest total, including third-party votes. Historical congressional-primary comparisons are deliberately absent because the 2026 election uses Missouri’s new 2025 congressional plan. Akashic’s 2020 and 2024 presidential totals have been rebuilt onto that map; the old congressional primaries have not.
The larger Missouri change was below Congress
Across all 163 Missouri House districts, Republican candidate votes were nearly unchanged from 2024 while Democratic votes increased by almost half.
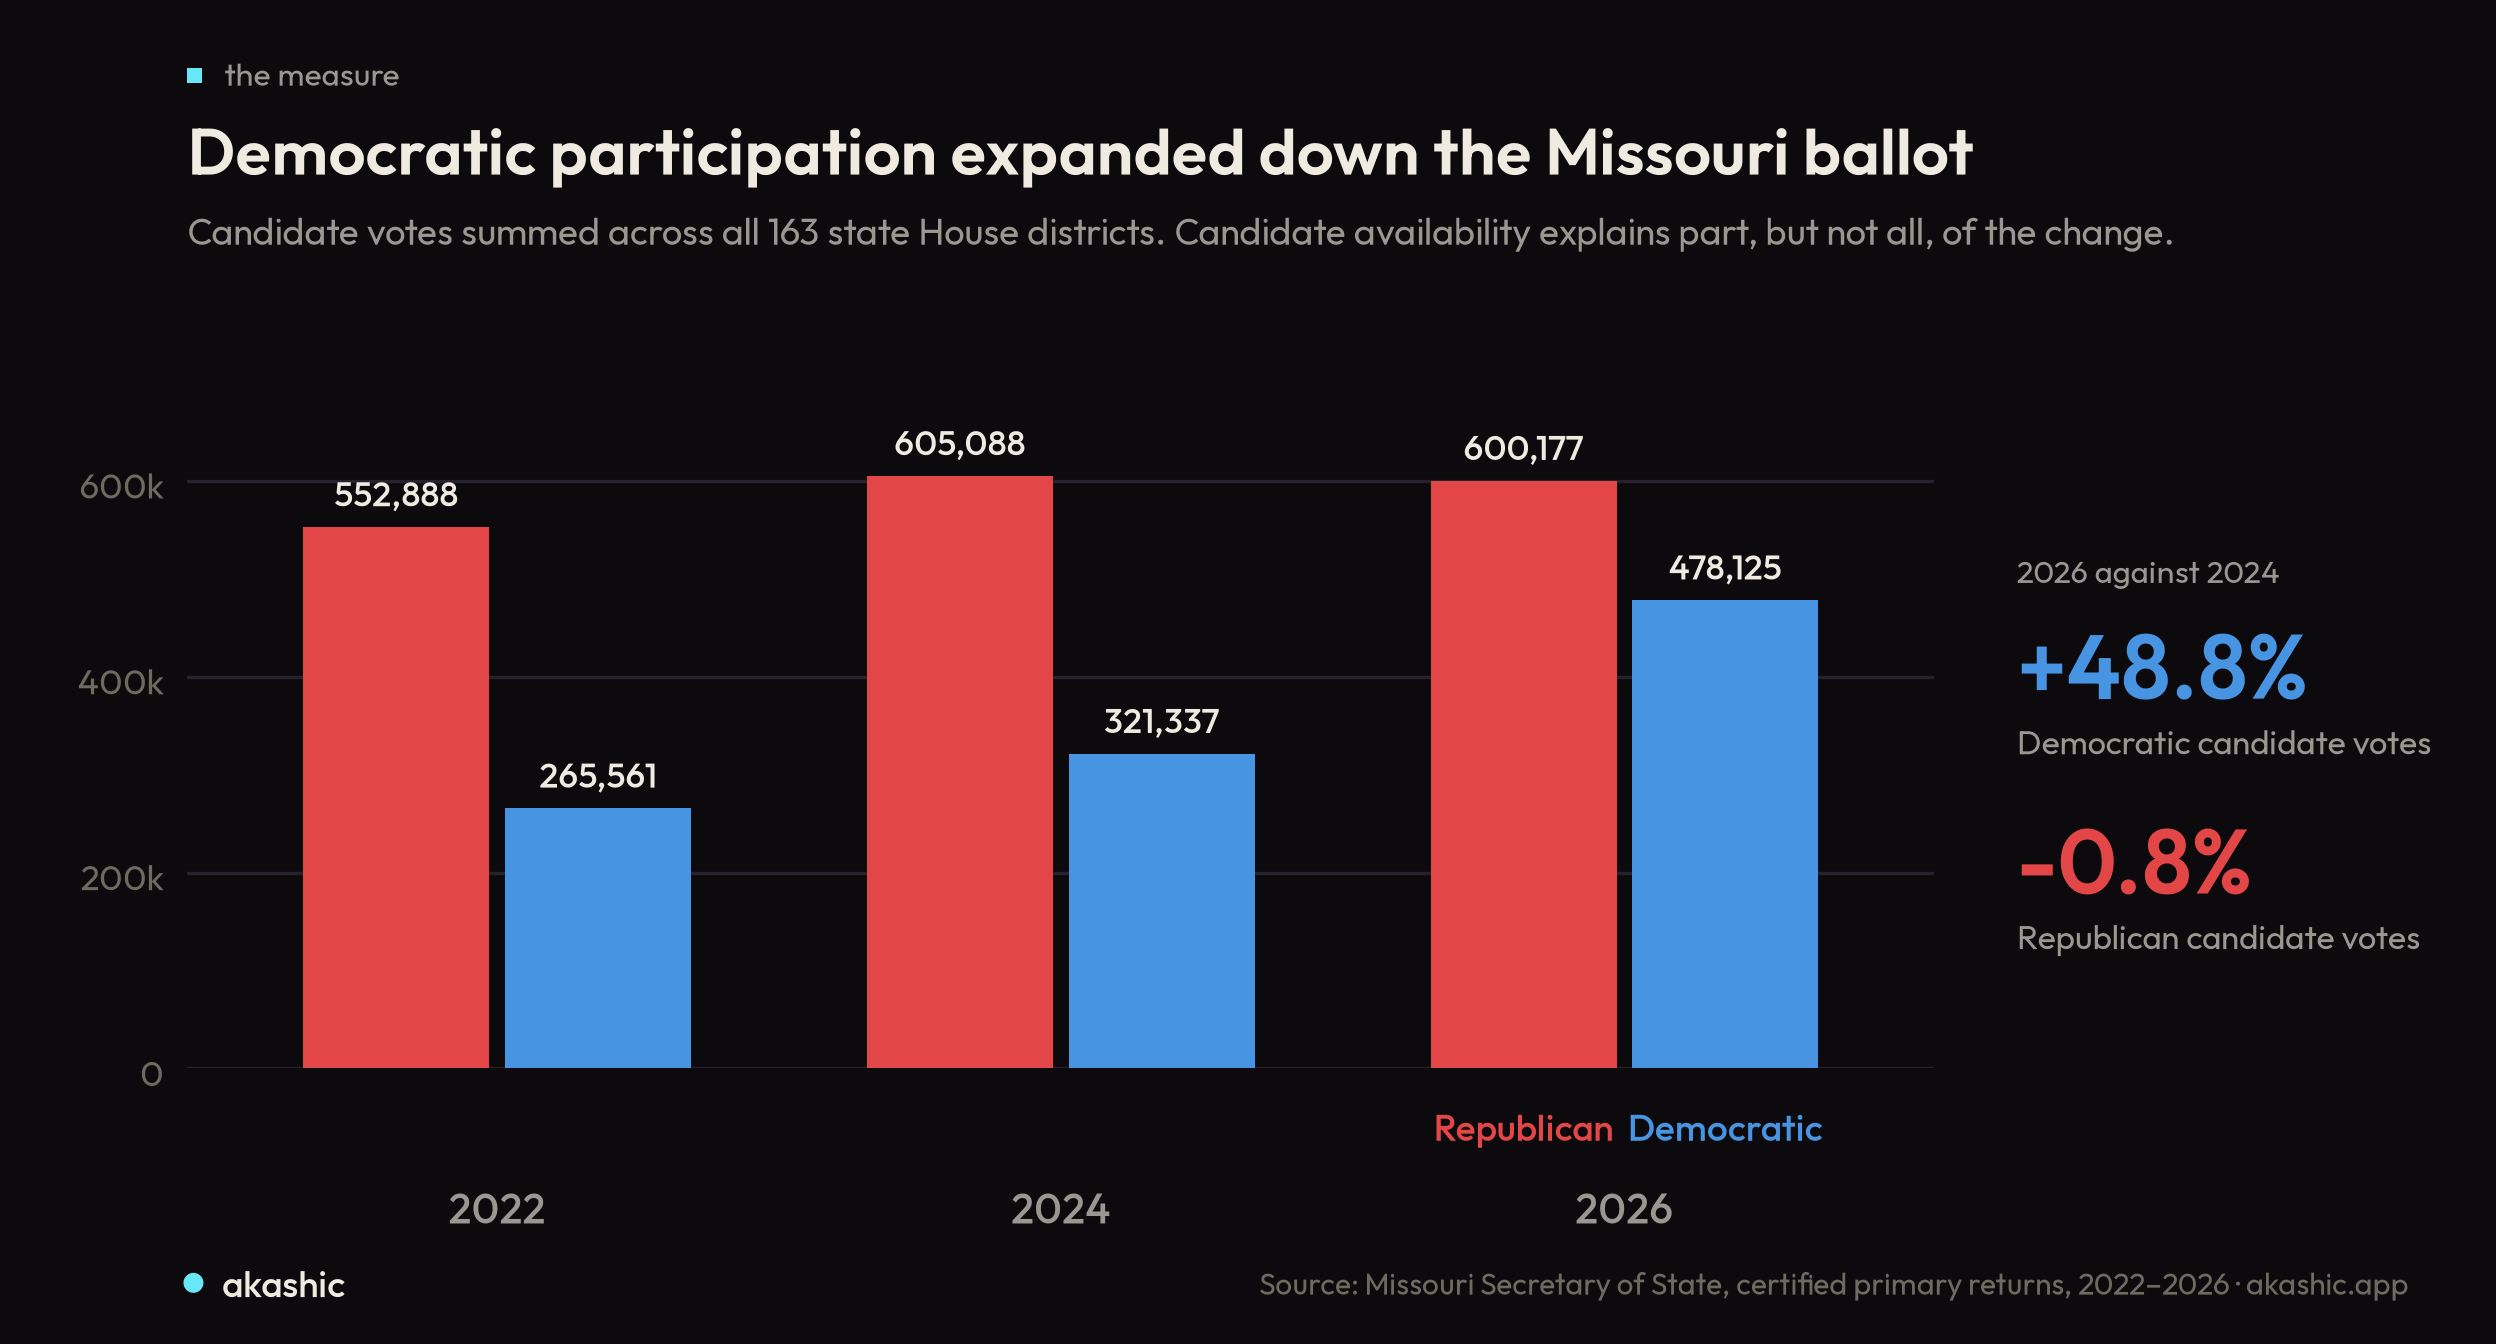
| Primary | Republican | Democratic | Other | Total |
|---|---|---|---|---|
| 2022 | 552,888 | 265,561 | 189 | 818,638 |
| 2024 | 605,088 | 321,337 | 121 | 926,546 |
| 2026 | 600,177 | 478,125 | 425 | 1,078,727 |
From 2024 to 2026, Democratic House candidate votes increased 48.8%, Republican votes declined 0.8%, and total House-contest participation increased 16.4%.
Some of the Democratic increase came from ballot access. Thirty House districts recorded no Democratic candidate votes in 2024; only five did in 2026. But candidate coverage is not the whole explanation. In the 98 districts where both parties recorded candidate votes in both years, Democratic votes still rose about 49.2%, compared with only 1.9% for Republicans.
Several districts moved sharply toward Democrats on the primary-participation measure:
- House District 95: R+26.5 in 2024 to D+2.7 in 2026.
- House District 88: R+28.4 to R+2.8.
- House District 100: R+17.0 to D+12.3.
- House District 44: R+39.8 to R+7.4.
- House District 101: R+16.0 to D+6.3.
These are not modeled general-election margins. They identify where Democratic participation changed most visibly.
Missouri Senate: a mixed metropolitan–rural split
For the Senate comparisons, the presidential baselines come from the actual live Akashic state-Senate district artifacts—the same records displayed on each district page.
The most important Democratic overperformances were:
- Senate District 8: D+11.3 in the primary after voting R+5.3 for president—a 16.6-point Democratic divergence.
- Senate District 24: D+33.2 in the primary versus D+13.7 for president—a 19.6-point Democratic divergence.
- Senate District 30: D+7.1 in the primary versus R+3.8 for president—an 11.0-point Democratic divergence. Democratic candidate votes increased 73.6% from the 2022 primary while Republican votes fell 19.5%.
- Senate District 22: R+22.0 in the primary versus R+33.5 for president—11.5 points less Republican.
Several rural districts moved the other way. Senate Districts 6, 18, 28, and 32 were about 13 to 18 points more Republican in primary participation than in the 2024 presidential vote. Senate District 2 was R+28.7 in the primary versus R+23.2 for president.
The Senate map therefore does not show one uniform statewide swing. Democratic participation was strongest relative to the presidential baseline in competitive suburban territory and the state’s Democratic metropolitan districts, while rural Republican districts frequently became even redder in the primary electorate.
Michigan: a much larger Democratic electorate
The Michigan state export used for the first pass omitted Wayne County from its statewide totals as well as from its district sections. After Wayne is added, Democratic gubernatorial candidates received 1,494,781 votes to 928,767 for Republicans. In the U.S. Senate primary, Democratic candidates received 1,527,283 votes to 879,859 for Republican Mike Rogers.
That produced provisional Democratic participation margins of D+23.4 for governor and D+26.9 for Senate. Wayne County had 719 of 720 precincts reporting in the snapshot. The competition caveat is substantial: Democrats had competitive statewide nominations, while Rogers was unopposed in the Republican Senate primary. The margins cannot be transferred directly to November.
Reconstructing the Wayne County gap
The state export did not merely omit districts located entirely in Wayne County. It also omitted the Wayne County portions of several districts crossing the county line. The final district totals therefore require two different operations:
- Fill districts absent from the state export with their Wayne County totals.
- Add Wayne County’s portion to the non-Wayne totals already reported for cross-county districts.
Treating every Wayne return as a new district row would double-count some contests; treating only the wholly missing districts would undercount others. The merged totals below apply the correct operation district by district.
The single outstanding Wayne County precinct affects Congressional District 6, Senate District 8, and House District 22. Every other district is complete in the available returns.
Congress: all 13 districts represented
After adding the Wayne portions, Democratic congressional candidates received 1,407,680 votes statewide, compared with 871,240 for Republicans. That is a D+23.5 participation margin across the combined district contests.
| District | Republican votes | Democratic votes | Primary margin |
|---|---|---|---|
| MI-01 | 108,282 | 106,107 | R+1.0 |
| MI-02 | 93,745 | 73,187 | R+12.3 |
| MI-03 | 68,559 | 110,114 | D+23.3 |
| MI-04 | 83,279 | 98,724 | D+8.5 |
| MI-05 | 76,989 | 64,178 | R+9.1 |
| MI-06* | 47,055 | 149,843 | D+52.2 |
| MI-07 | 72,457 | 128,098 | D+27.7 |
| MI-08 | 61,770 | 104,231 | D+25.6 |
| MI-09 | 103,291 | 74,349 | R+16.3 |
| MI-10 | 62,967 | 99,950 | D+22.7 |
| MI-11 | 49,354 | 147,832 | D+49.9 |
| MI-12 | 24,691 | 138,925 | D+69.8 |
| MI-13 | 18,801 | 112,142 | D+71.3 |
*MI-06 is one Wayne County precinct short.
The Detroit-based 13th District voted D+71.3 in primary participation, compared with D+40.9 for president in 2024. Donavan McKinney defeated Shri Thanedar in the Democratic nomination, while the Republican nomination was nearly uncontested. The primary electorate was therefore about 30 points more Democratic than the presidential electorate, but much of that difference is attributable to the competitive Democratic contest.
The geography was broader than Detroit. Democratic candidate votes led in several districts Donald Trump carried in 2024, including the 4th, 7th, 8th, and 10th. The 7th and 10th were especially far from their recent presidential baselines, although nomination competition must remain part of the interpretation.
State Senate: all 38 districts represented
Across the 38 remedial Senate districts, Democratic candidates received 1,348,893 votes and Republicans 856,857. That is D+22.3 across the combined Senate contests. Senate District 8 remains one Wayne County precinct short; every other district is represented completely.
Because Michigan’s remedial Senate plan is first being used for the senators elected in 2026, these results cannot be matched directly to the 2022 Senate primary by district number. Presidential comparisons can be made only with results rebuilt onto the remedial boundaries.
State House: all 110 districts represented
Across all 110 House districts, Democratic candidates received 1,291,725 votes and Republicans 843,471. That is D+21.0 across the combined House contests. House District 22 remains one precinct short, so these statewide totals are provisional by a small amount.
The Wayne supplement is not a trivial add-on. It supplies many of the most Democratic districts in the state and completes several cross-county contests. Among the newly filled districts, Democratic participation margins included approximately D+95.5 in HD-4, D+95.3 in HD-9, D+94.1 in HD-7, D+87.7 in HD-1, and D+82.2 in HD-3. Those figures describe nomination participation, not expected November margins; several Republican contests were effectively uncontested or attracted very little activity.
Michigan’s House remedial plan was first used in 2024, making the 2024 House primary the direct historical comparison. A 2022 district-number comparison requires district-specific validation or reconstruction because the remedial districts were not yet in effect.
What August 4 actually says
Four conclusions survive the caveats.
First, Missouri Democrats substantially expanded their down-ballot primary footprint. The increase remained close to 50% even in House districts where both parties had candidates in both 2024 and 2026.
Second, the new Missouri 2nd District did not behave like an R+11.5 electorate at the participation stage. Its congressional party-contest vote was essentially tied.
Third, Michigan’s Democratic participation advantage was broad across offices: D+23.4 for governor, D+26.9 for U.S. Senate, D+23.5 in the combined congressional contests, D+22.3 in state Senate contests, and D+21.0 in state House contests after properly incorporating Wayne County.
Fourth, competition remains an essential explanatory variable. Several of Michigan’s largest Democratic margins paired a competitive Democratic nomination with a lightly contested or uncontested Republican race. The numbers measure which party contests voters entered; they do not constitute a direct November forecast.
A primary electorate is not the general electorate. It is the portion already awake. On August 4, Democrats appeared considerably more awake than their recent baseline in much of Missouri’s competitive territory and across a broad range of Michigan districts.
Method and sources
“Party participation” means the sum of votes cast for all candidates of a party in a specific contest. It does not count every party ballot issued. Voters can skip a contest, uncontested races can suppress participation, and nomination competitiveness can change the total.
Missouri’s 2026 totals come from the Missouri Secretary of State election-night reporting system. The 2022 and 2024 General Assembly comparisons come from the certified state canvasses. Presidential district benchmarks come from Akashic’s live static district artifacts on the boundaries used for the 2026 election.
Michigan’s non-Wayne totals come from the Michigan Department of State August 4 result export supplied for this analysis. Wayne County totals come from the county’s August 5 result snapshot. The merge retains contest- and district-level coverage status and does not treat the missing precinct as zero. The statewide contests, Congressional District 6, Senate District 8, and House District 22 remain one Wayne County precinct short in the current snapshot. The congressional figures use Akashic’s canonical current-district geometry.
Sources: Missouri Secretary of State election results; Michigan election results and data; Michigan August 4 results; Wayne County August 4 results; Michigan Senate district maps; Michigan redistricting mapping data.