In Borden County, Texas — a square of ranchland with fewer than seven hundred voters — the best day the Democratic Party has ever had came in 1932, when Franklin Roosevelt carried it by 94 points. The best day the Republican Party has ever had there came in 2020, when Donald Trump carried it by 92. Nothing about Borden County moved quietly. It simply traveled the whole distance, from one party's high-water mark to the other's, inside a single long human life.
Most election maps answer one question: who won. Turn the map around — ask each place not who carried it last, but which nominee in its entire history ever did best there — and a different picture rises out of the data. Every county has a favorite Democrat and a favorite Republican: the candidate who, across every election that county has ever held, drew its widest margin. Akashic now carries that figure for all 3,143 counties, and for every state, metro area, and media market besides. Mapped, the answer is a portrait of when each party's coalition reached its peak — and the two portraits do not look alike.
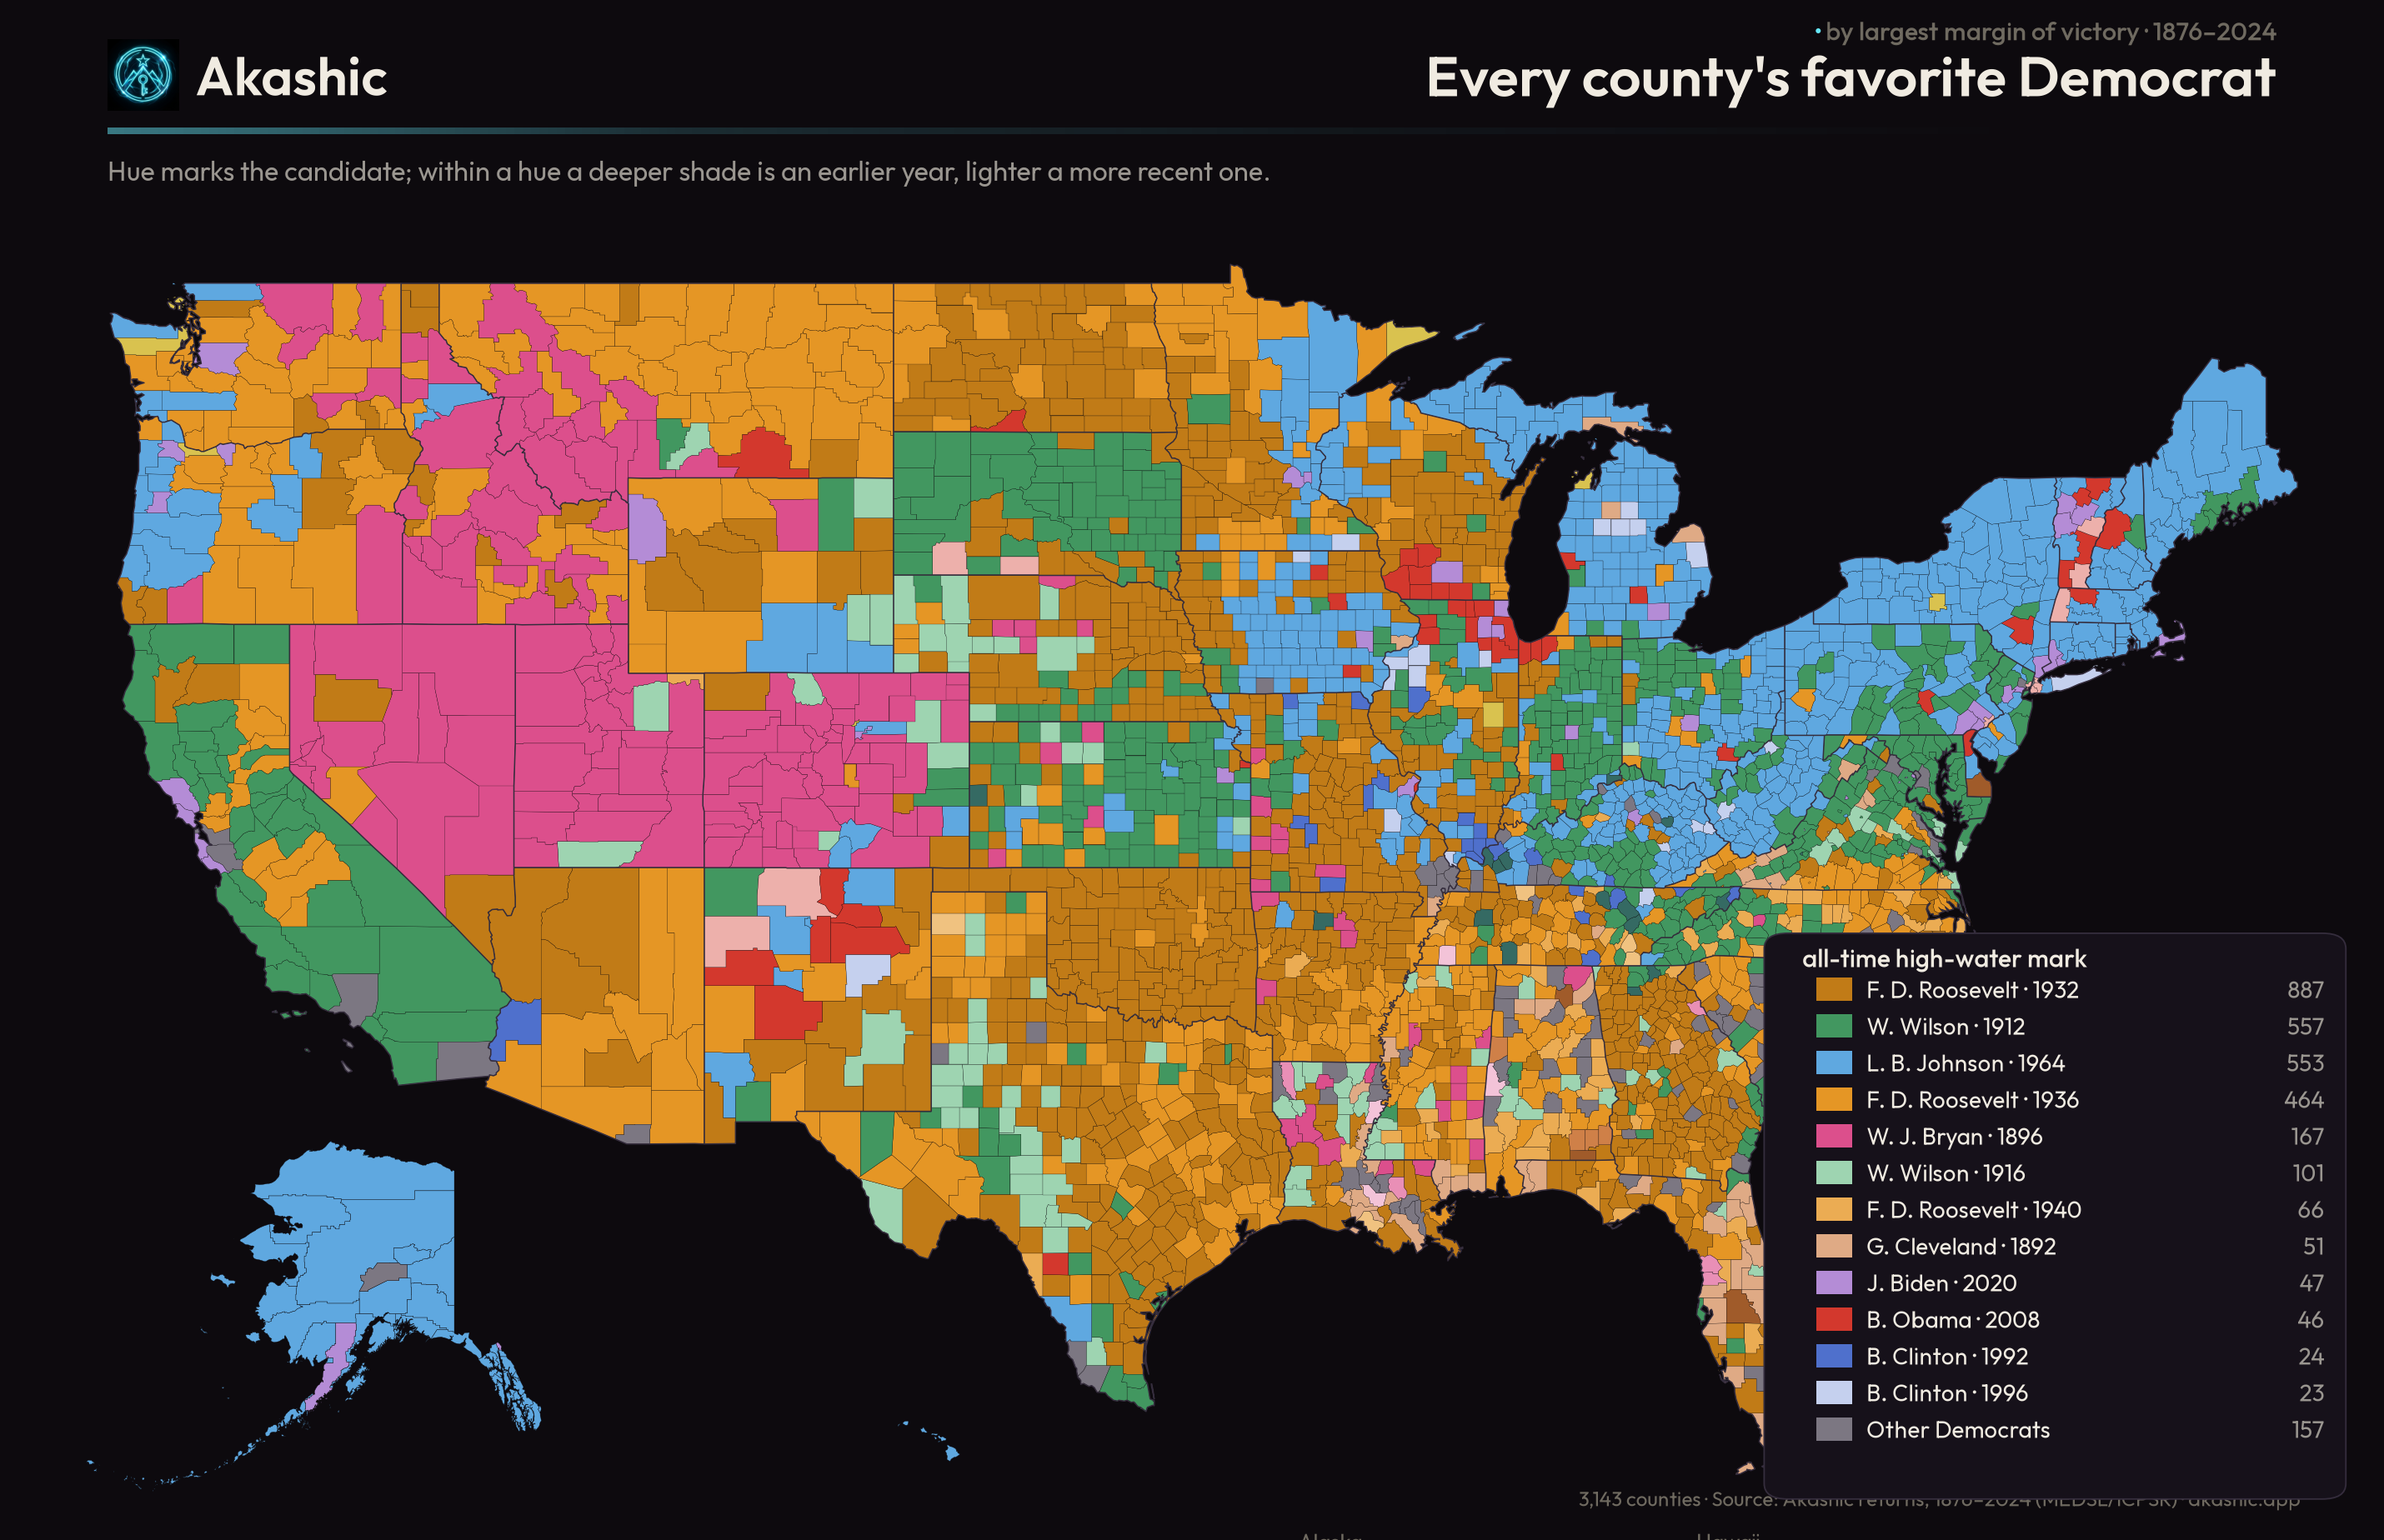
The Democratic map is a museum. In 94 percent of American counties, the strongest Democratic showing on record predates 1965 — most often Roosevelt in 1932 or 1936, or Woodrow Wilson before him, or the Solid South decades when the Republican line across the old Confederacy drew almost no votes at all. Only one county in twenty-five has set its Democratic high-water mark in the twenty-first century.
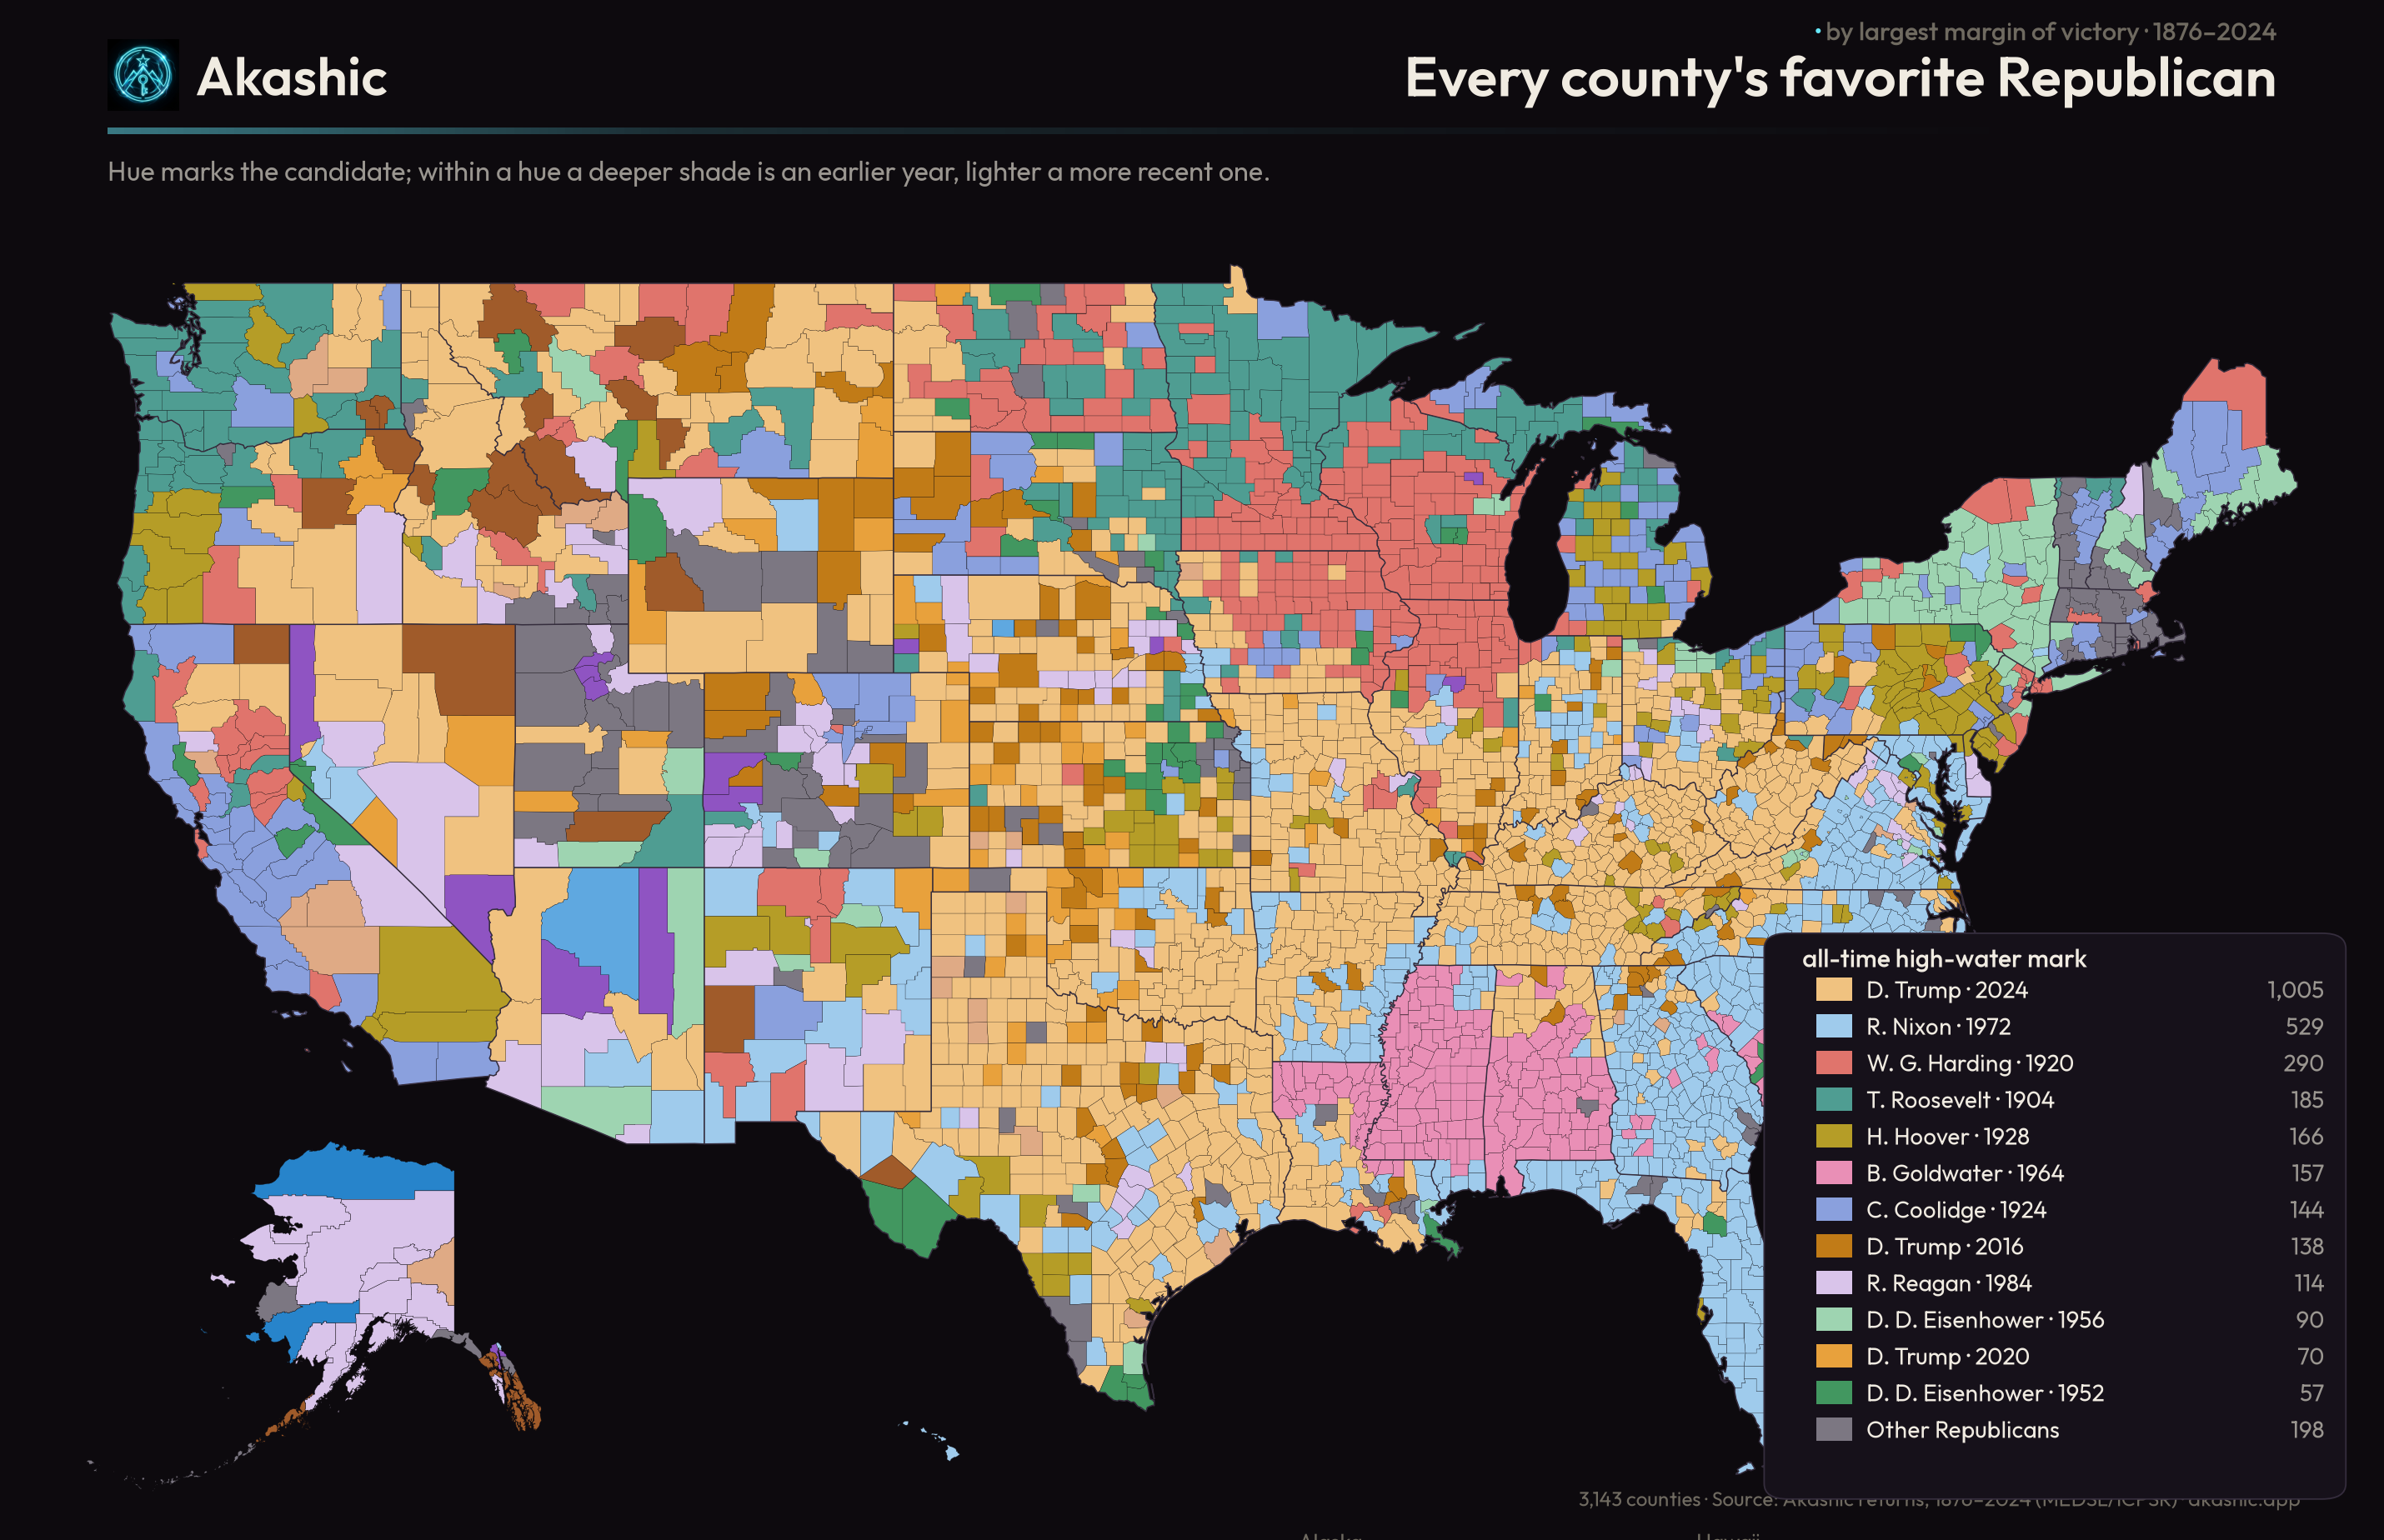
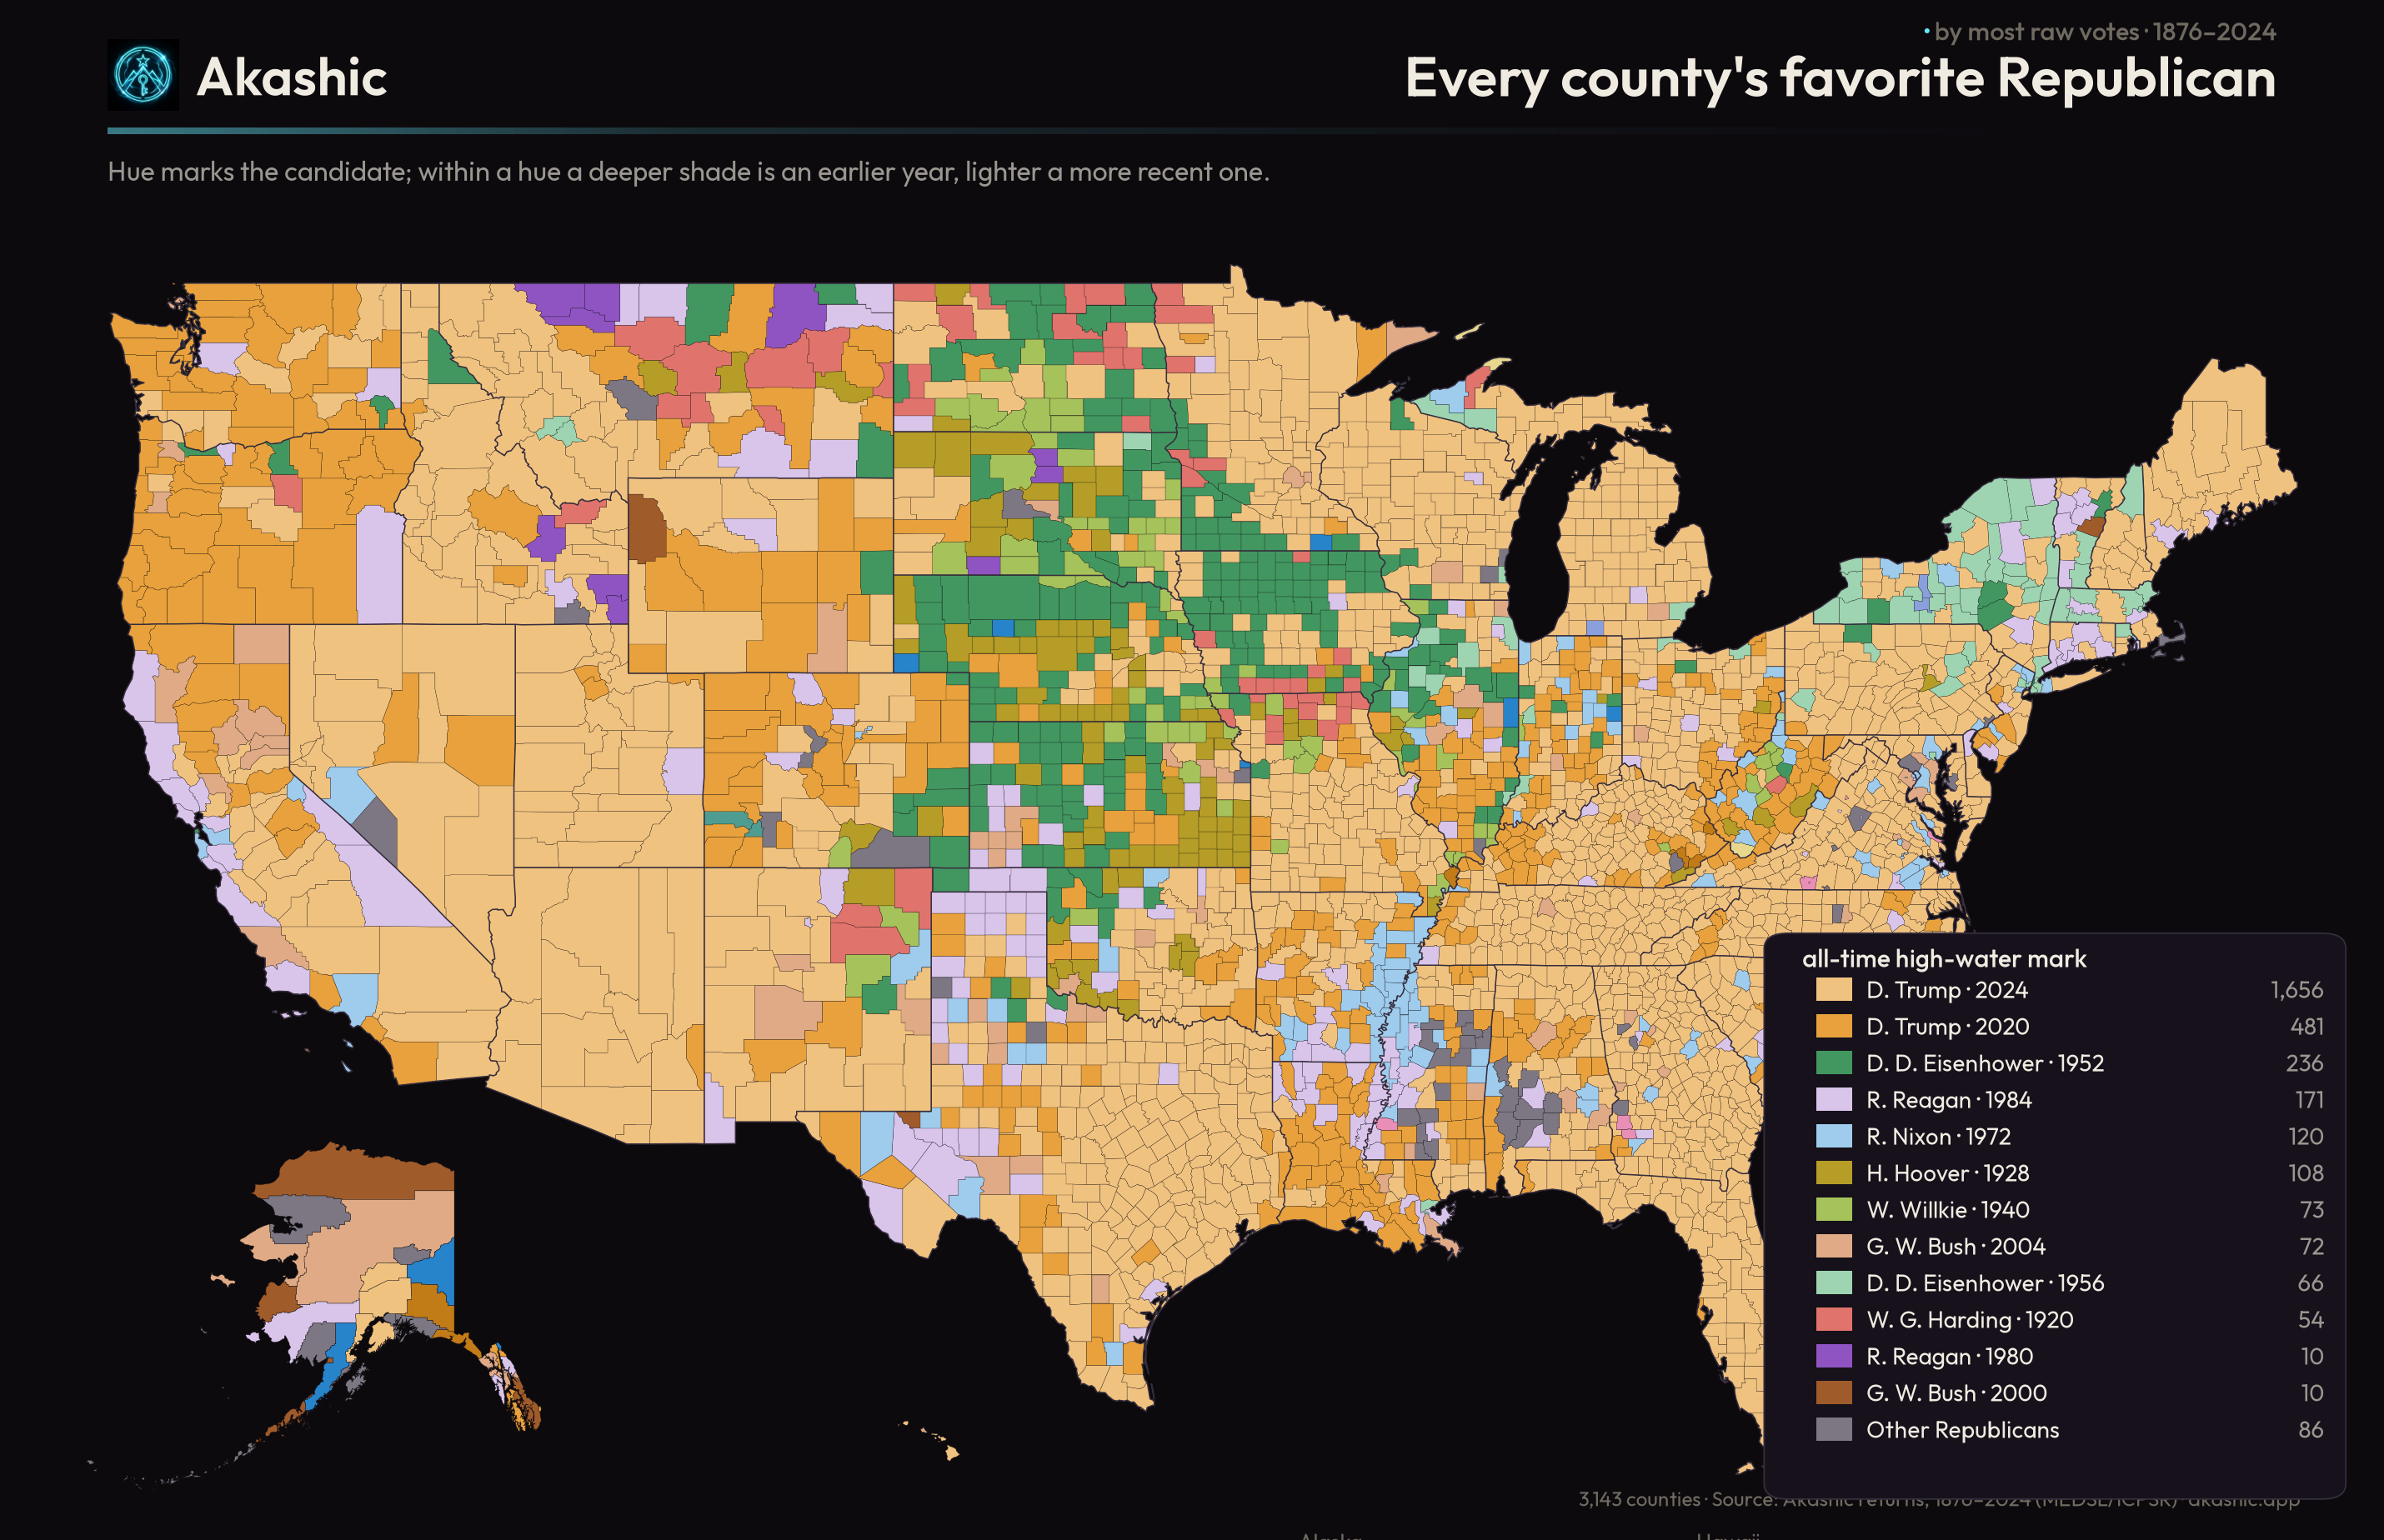
The Republican map is the reverse. In nearly four counties of every ten — 1,241 of them — the strongest Republican showing ever recorded arrived between 2016 and 2024. Donald Trump is the best-ever Republican in 1,213 counties, more than any Republican in the country's history: more than Nixon's forty-nine-state sweep of 1972, more than the Harding and Coolidge landslides of the 1920s, more than Reagan.
That asymmetry is the realignment, compressed to a single fact. The two coalitions did not peak at the same time, and they did not peak in the same places — except where they did, which is the most telling part of all.
The same ground, changing hands
Borden County is not an exception; it is a category. In 994 counties — nearly a third of the country — the all-time best Democrat is Roosevelt or Wilson and the all-time best Republican is Trump. The New Deal's deepest territory and the modern Republican Party's deepest territory are, to a striking degree, the same soil: the rural South, Appalachia, the Great Plains. Cameron Parish, Louisiana gave Roosevelt 98 points in 1932 and Trump 86 in 2024. Echols County, Georgia gave Wilson a clean hundred in 1916 and Trump 82 a century later.
The mirror image is smaller, and just as sharp. Ninety-two counties were at their most Republican under Harding or Coolidge in the 1920s and are at their most Democratic now, under Joe Biden. They are not in the South. They are the affluent edges of the coastal metros — Marin County, California, most Republican in 1924 and most Democratic in 2020; San Mateo, Sonoma, Denver.
Hold the two side by side and the century resolves into a single motion. A ranching county in West Texas went from Roosevelt's best to Trump's. A wealthy county north of San Francisco went from Coolidge's best to Biden's. The same hundred years, run in opposite directions — the two halves of one realignment.
Where the recent names peak
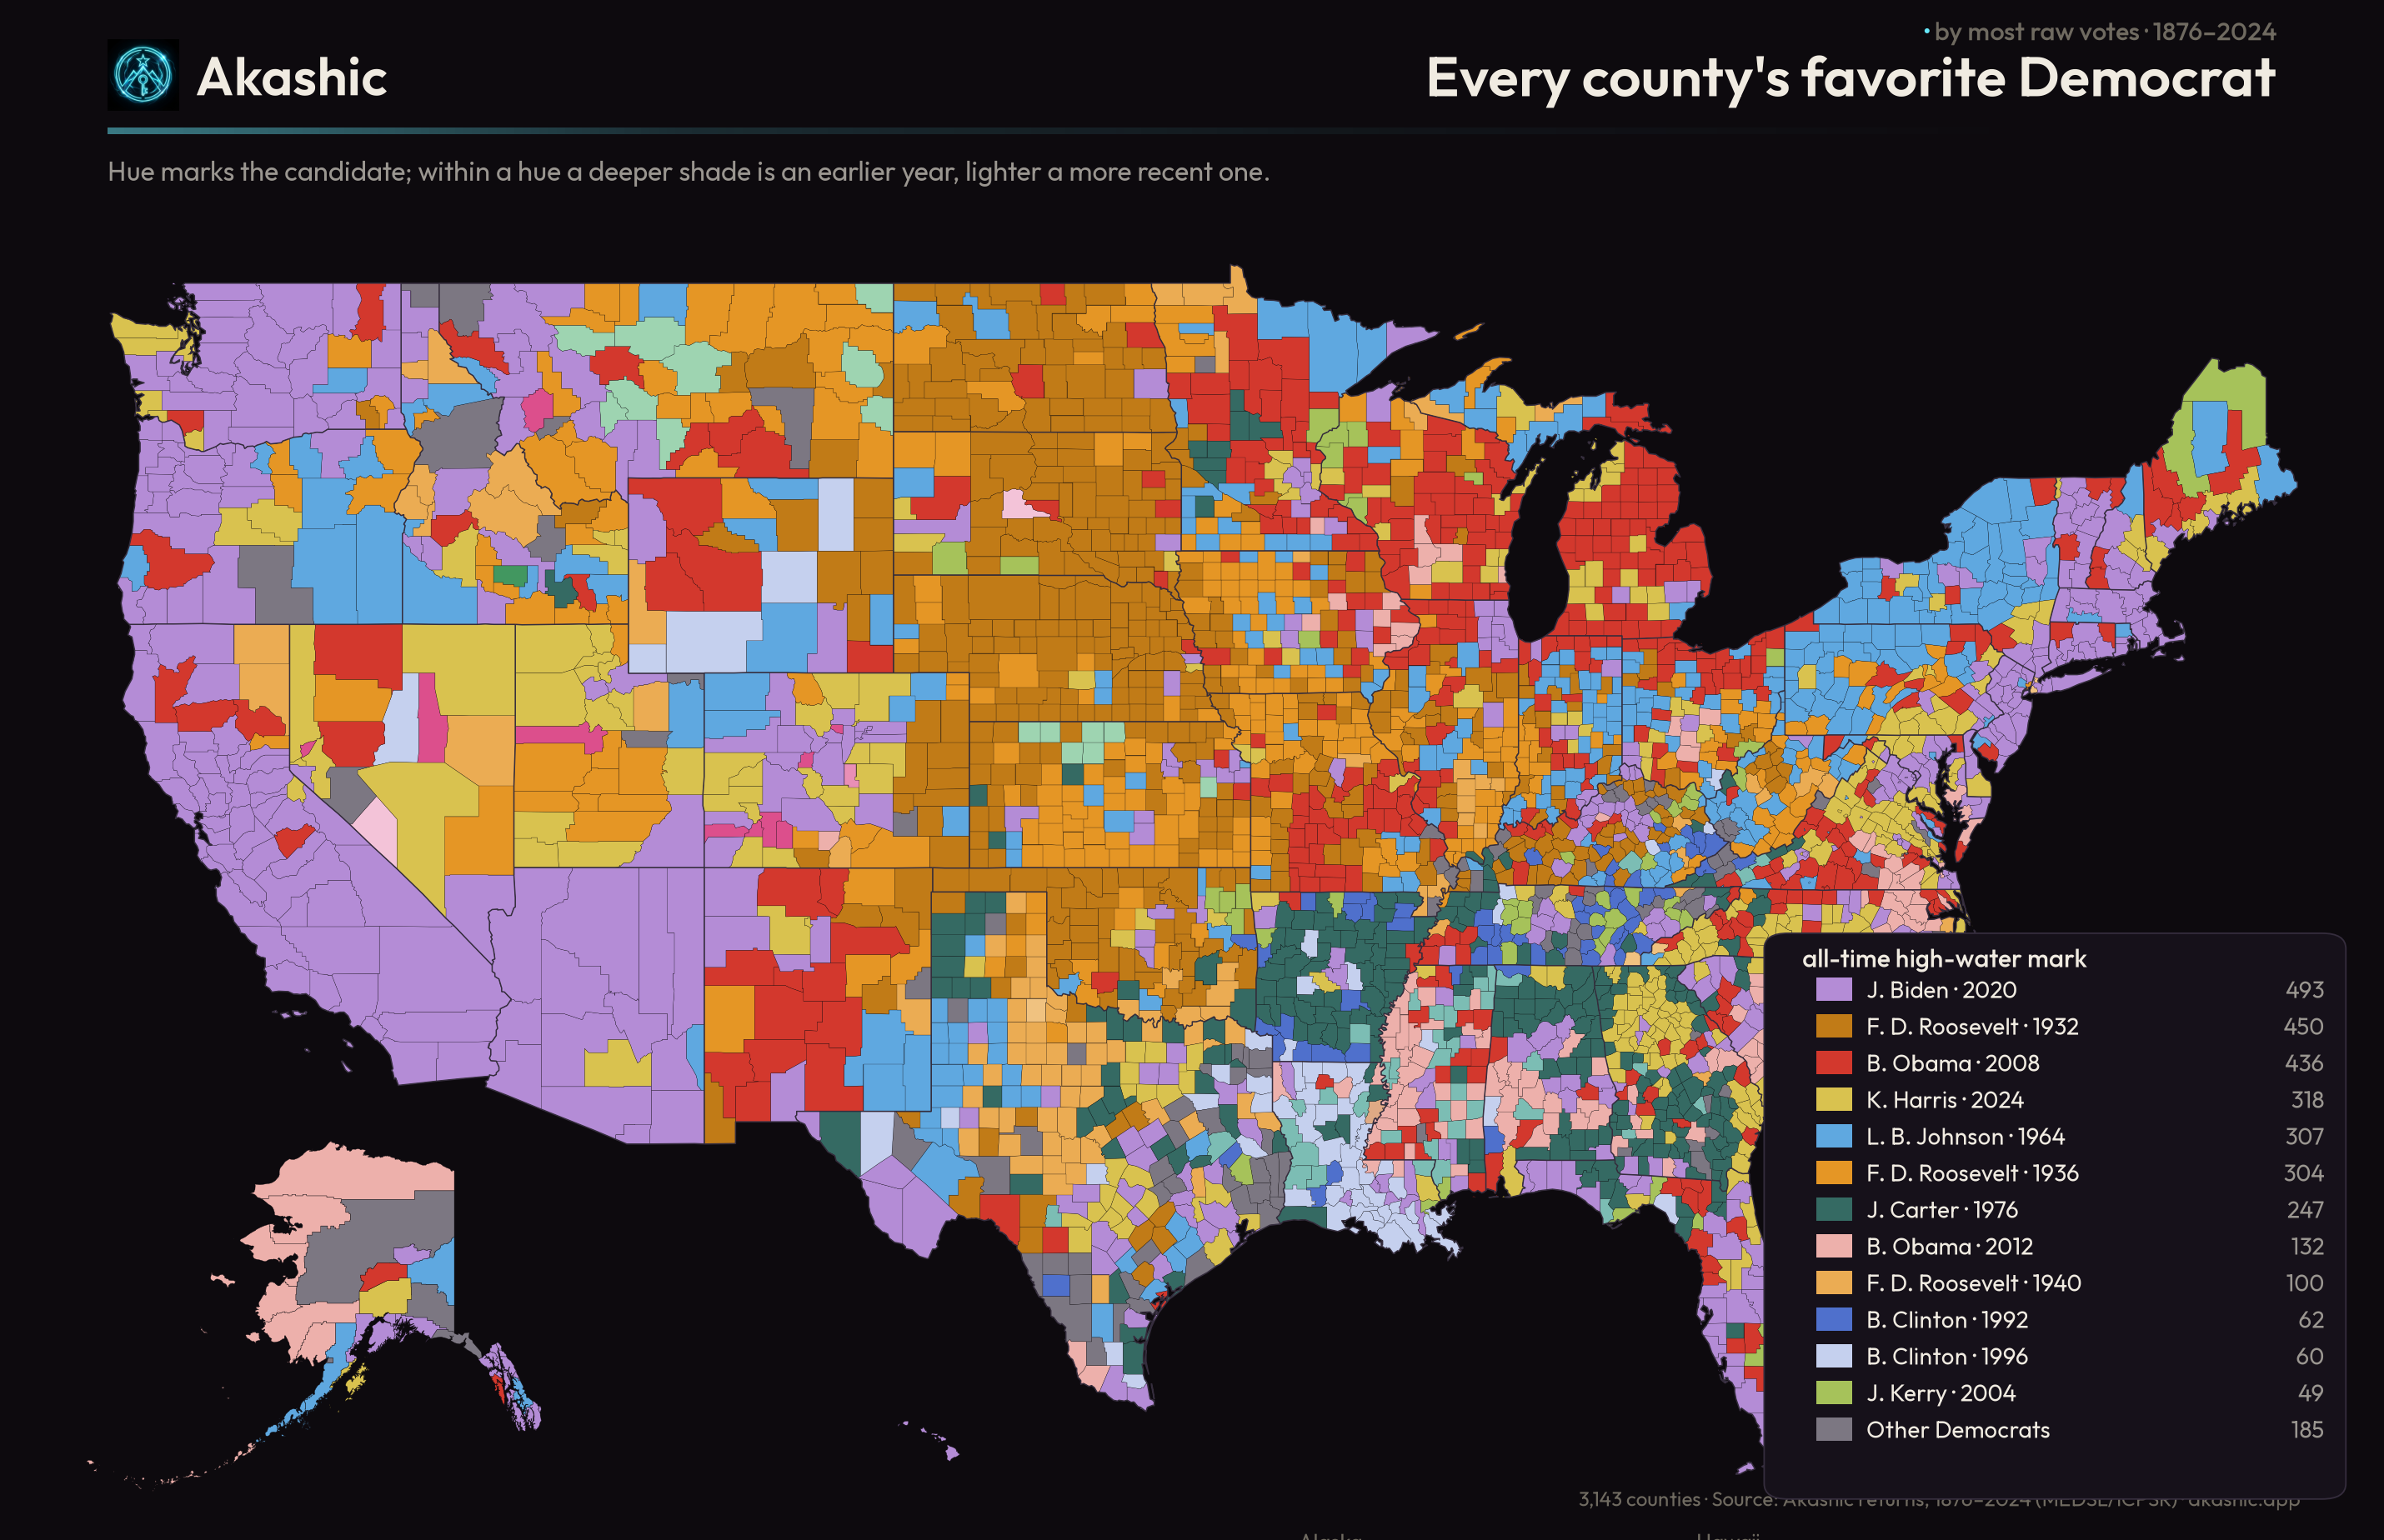
Because the Democratic high-water map is mostly historical, the party's recent nominees hold little of it by margin — and where they do hold it is its own kind of map. Barack Obama is the best-ever Democrat in 59 counties, and they fall into three Americas: the reservations of the northern Plains (Oglala Lakota County, South Dakota, home to Pine Ridge), the historically Black urban cores (Philadelphia; the Bronx), and a scatter of college towns. Biden's 47 are the affluent suburbs above. Kamala Harris's eight are college-town and Pacific Northwest blue — Multnomah County, Oregon; Tompkins County, New York, where Cornell sits.
The Republican story runs the other way: not a few redoubts but a flood. Beyond Trump's 1,213, the older modern Republicans keep their pockets — George W. Bush across the Texas Panhandle and the Mormon West, Mitt Romney in the Latter-day Saint counties of Idaho. But the governing fact of the Republican map is its recency, and the governing name is Trump's.
A second reading hides beneath the first. Ask not where each party drew its widest margin but where it drew its most votes, and the recent Democrats reappear — not in the rural margins but in the dense, growing metros, where Obama, Biden, and Harris each set the all-time Democratic vote record. A coalition can stand at its geographic peak in fewer places and still be larger than ever, if those places are big enough. The margin map and the vote map disagree, and the disagreement is the whole shape of the modern Democratic Party: narrower ground, deeper wells.
Zoom out, and the clock changes
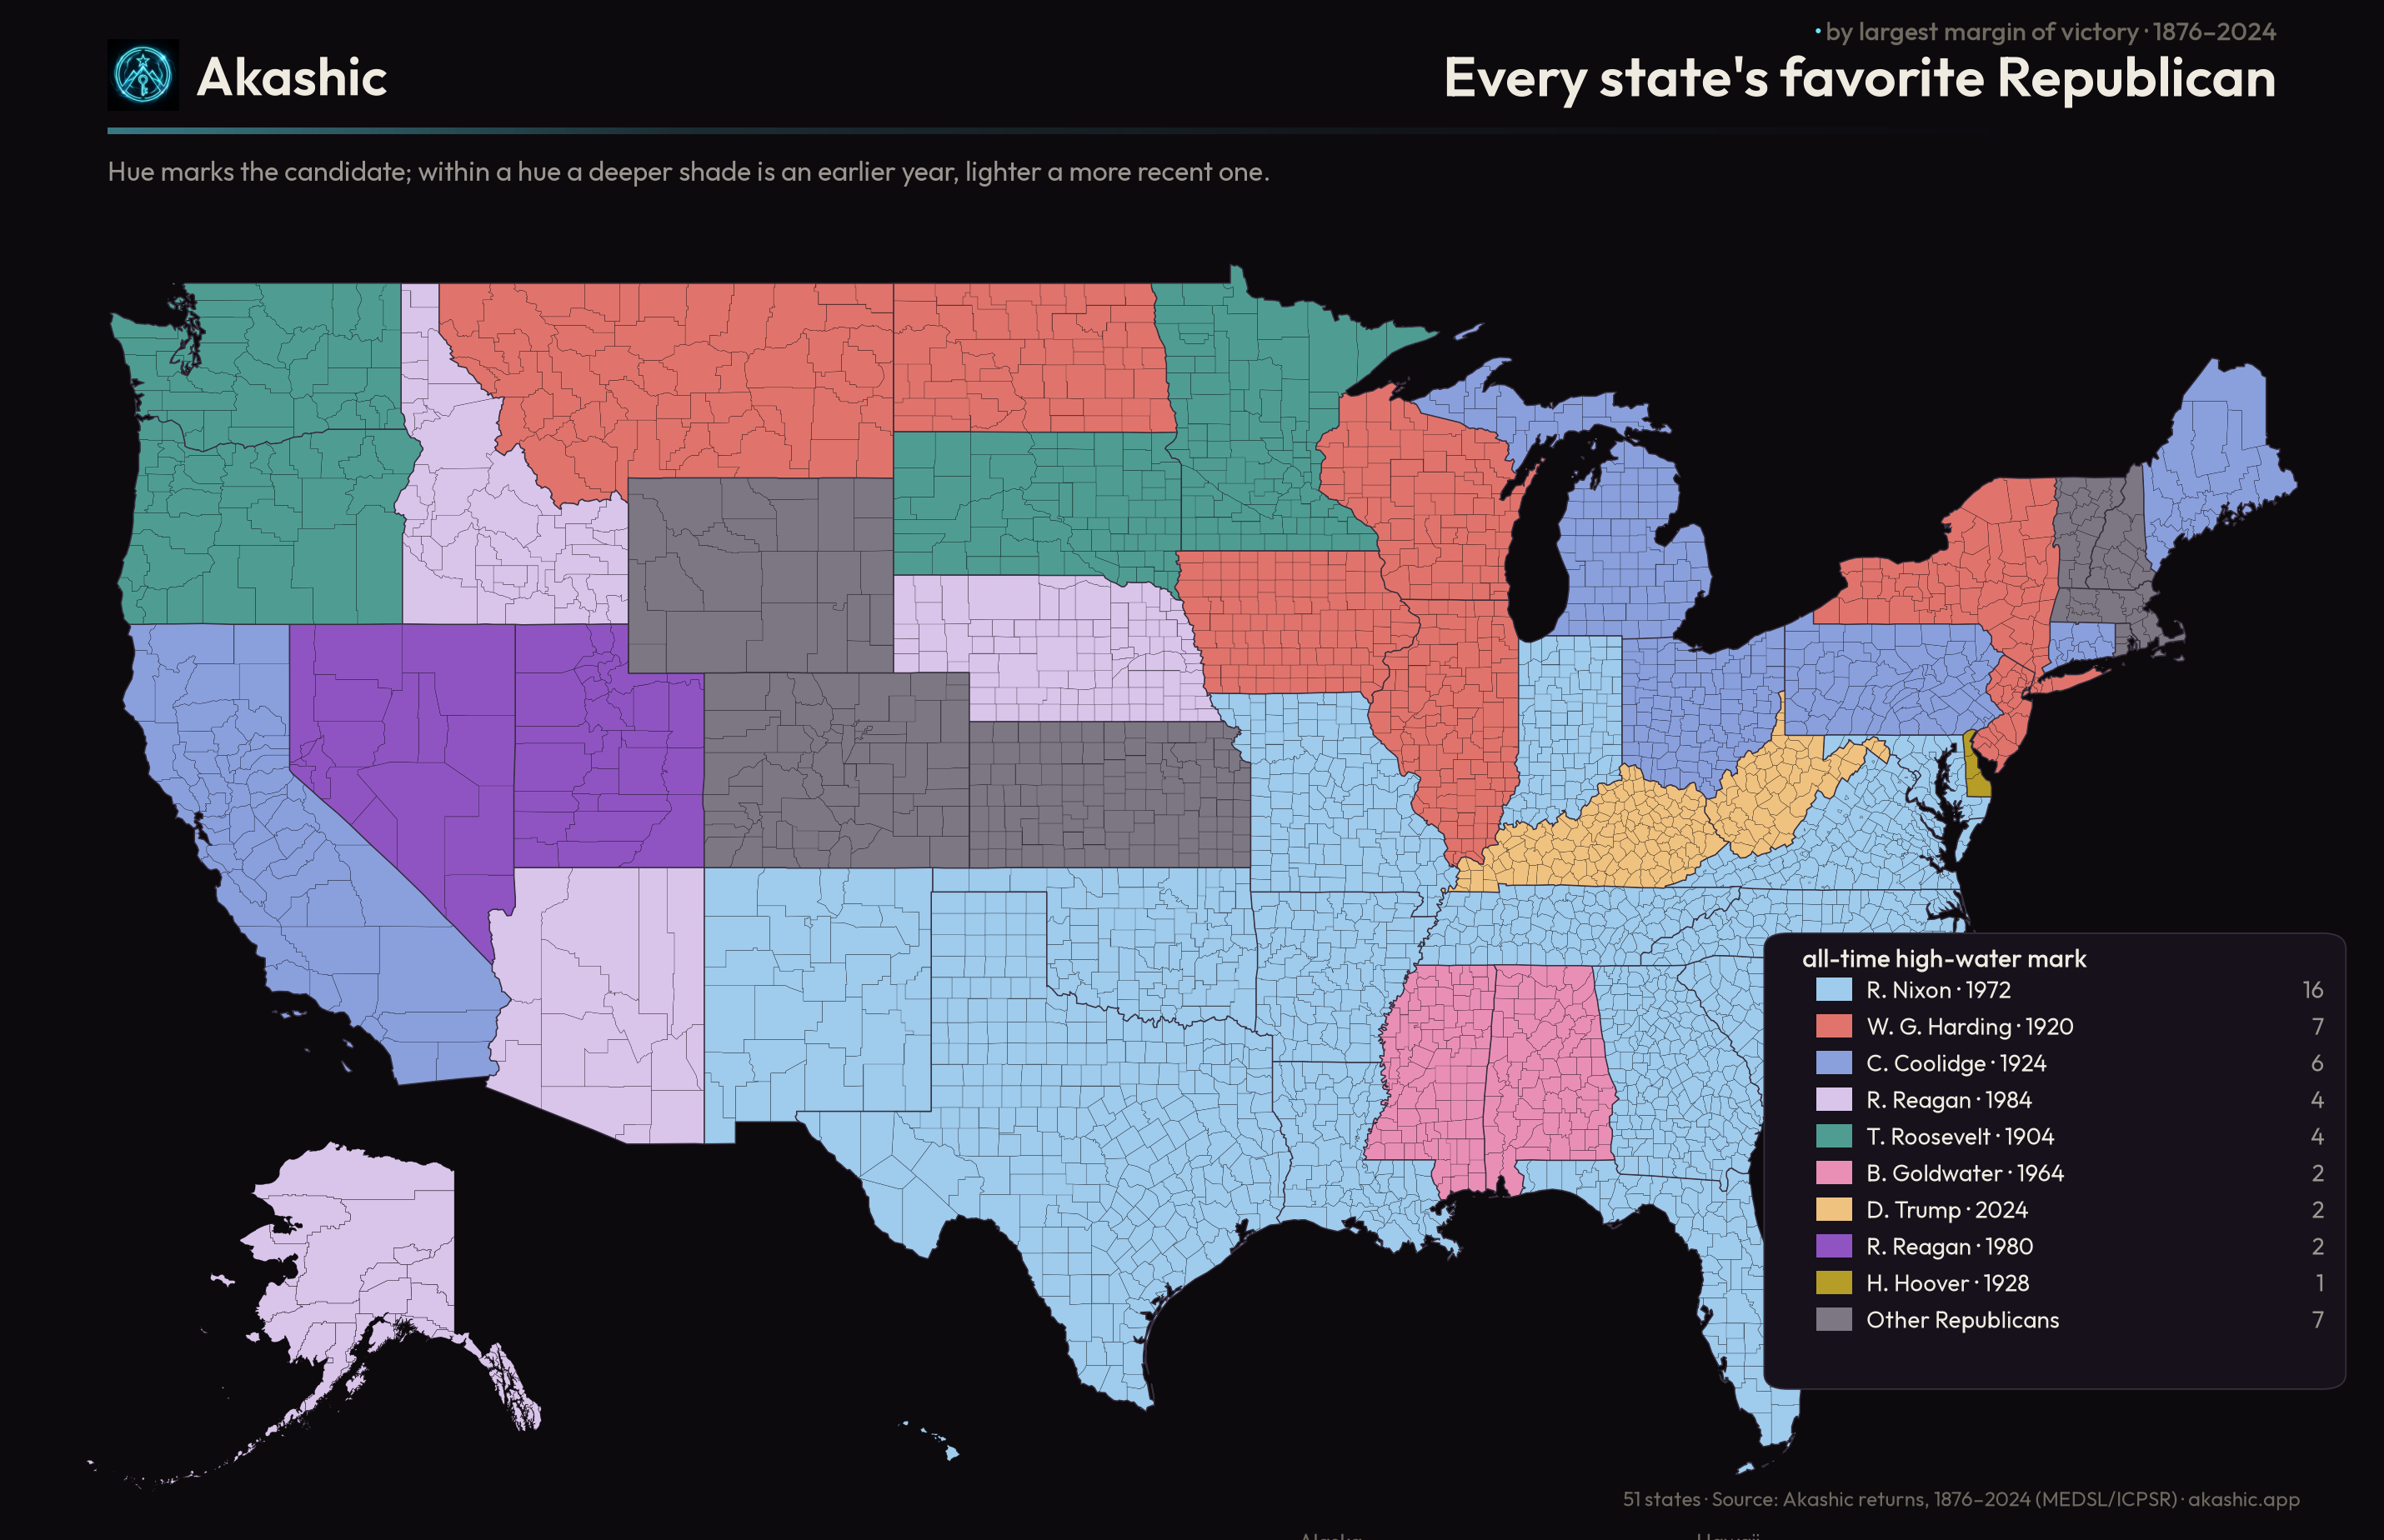
The picture depends on altitude. At the county level Trump is the modern Republican colossus; at the state level, where a margin must be run up across millions of voters rather than hundreds, he is the best-ever Republican in just two states — Kentucky and West Virginia. Statewide, the Republican high-water mark is still mostly Nixon's 1972 sweep and the 1920s. Wide margins are easy in a thousand-vote county and hard across a whole state.
The states carry the realignment in miniature, two at a time. Vermont was the most Republican state in the union in the nineteenth century — McKinley took it by 63 points in 1896 — and reached its Democratic peak under Obama in 2008. West Virginia ran the opposite way: its best Democratic day was Lyndon Johnson in 1964, its best Republican day Trump in 2024. One state climbed as the other fell, and they crossed somewhere near the middle of the last century.
What a high-water mark is
A high-water mark is not a forecast. It is a portrait of a coalition at the moment it reached furthest into a place — and like every high-water mark, it is clearest once the water has drawn back. The New Deal coalition's marks are scratched into nine counties in ten, far above the line the Democratic Party reaches there today; they measure how much ground a party can hold and then surrender. The current Republican map sits near its own high-water line right now, across more of the country than any Republican coalition before it.
Whether 2024 proves to be that coalition's 1936 — the peak it will be measured against for the next half-century — or only a way-station on a line still rising, the data cannot yet say. What it can say is where the marks are, that they have moved, and that they now stand further, in more places, than at any time since the last great realignment carried the very same ground the other way.